English · PDF 53
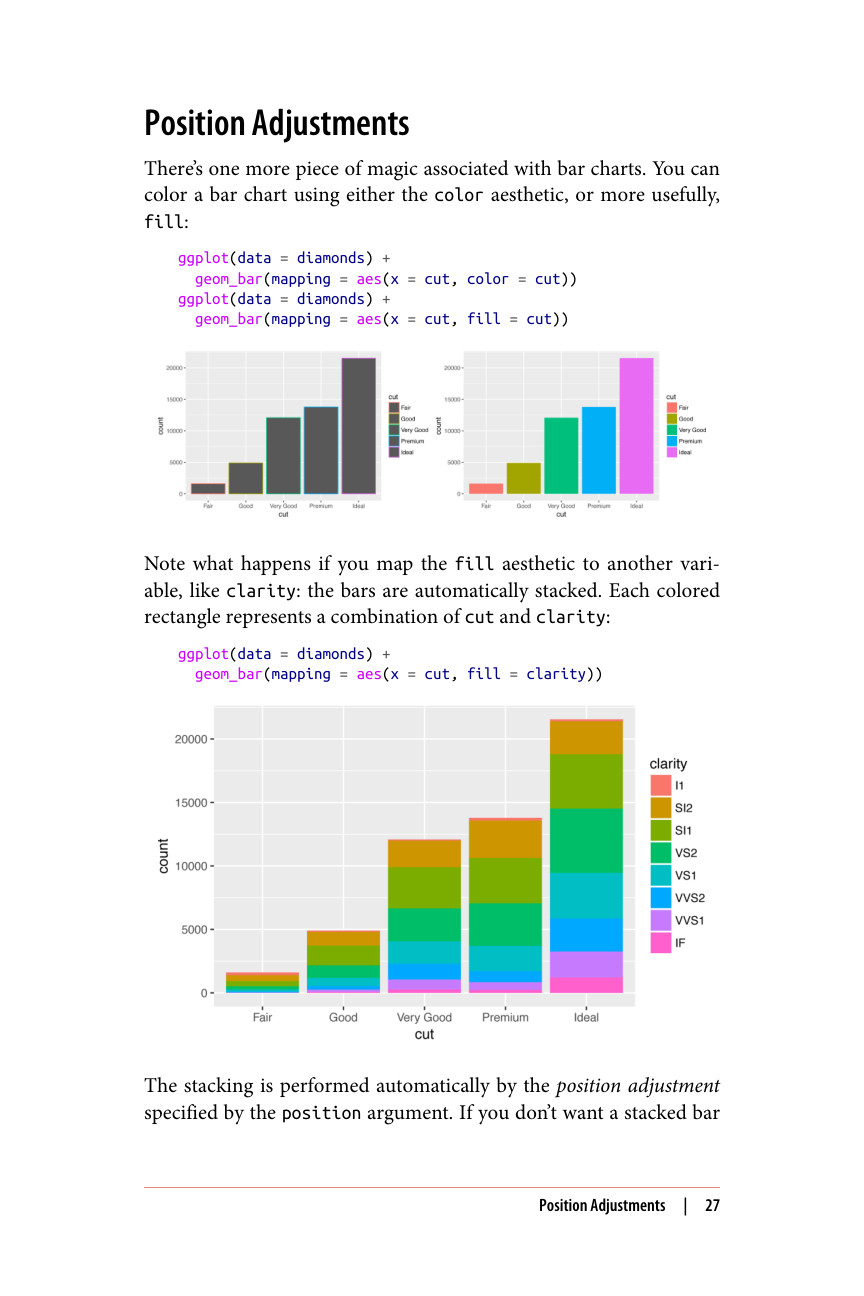
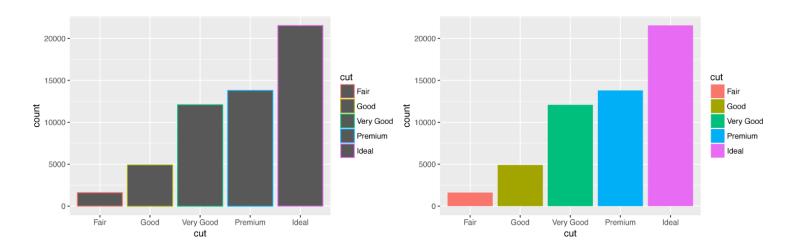
条形图还有一个相关的魔法。你可以使用 color 美化为条形图着色,或者更有用的是,使用 fill:
ggplot(data = diamonds) + geom_bar(mapping = aes(x = cut, color = cut)) ggplot(data = diamonds) + geom_bar(mapping = aes(x = cut, fill = cut))
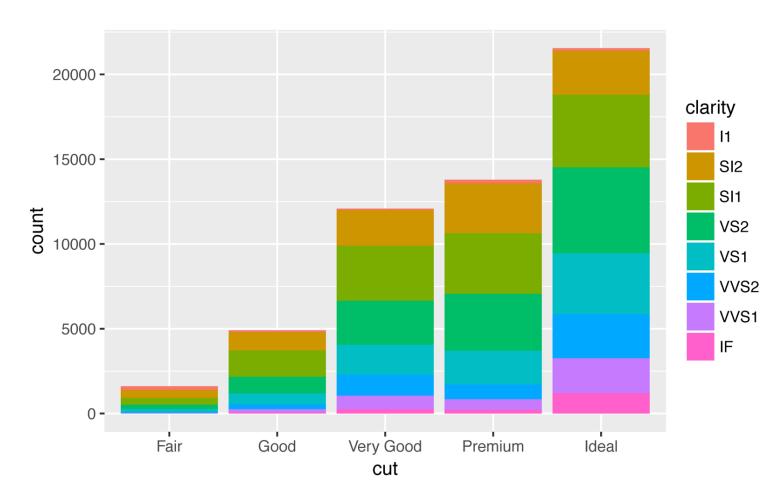
注意,如果你将 fill 美观映射到另一个变量(比如 clarity),会发生什么:条形会自动堆叠。每个彩色矩形代表 cut 和 clarity 的一种组合:
ggplot(data = diamonds) + geom_bar(mapping = aes(x = cut, fill = clarity))
堆叠是由 position 参数指定的位置调整自动完成的。如果你不想要堆叠条形图