English · PDF 52
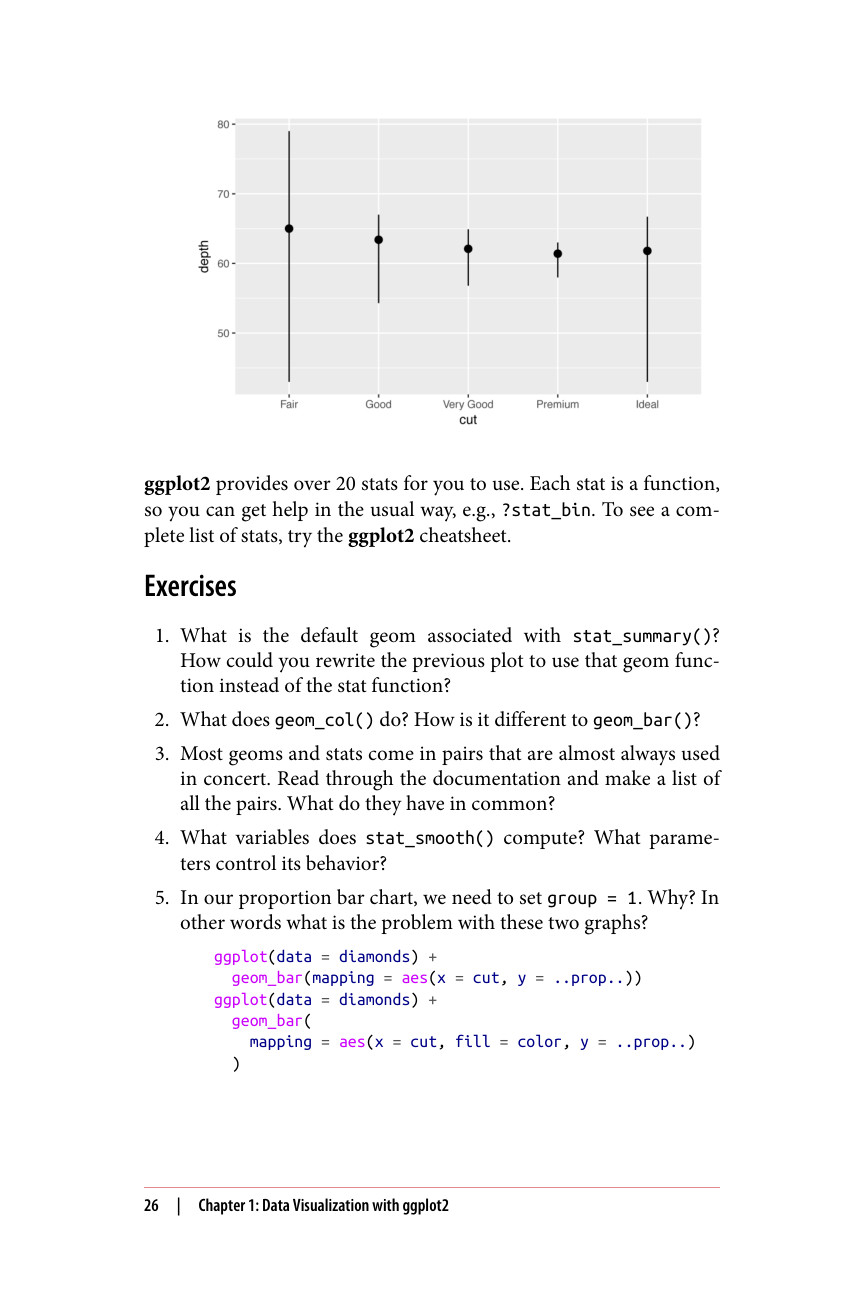
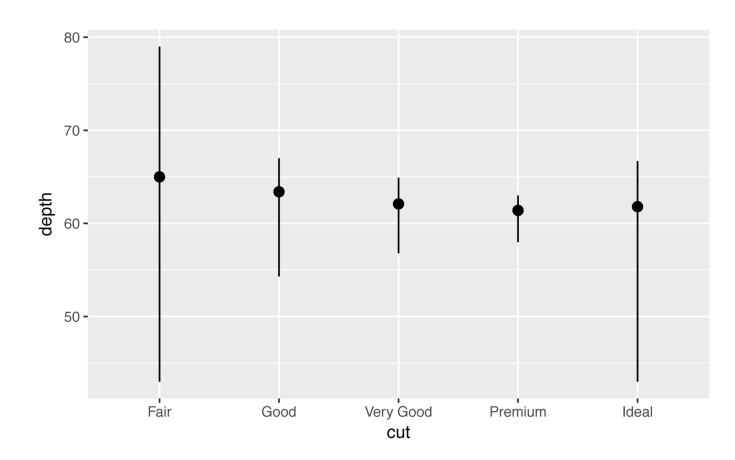
ggplot2 提供了 20 多个统计变换(stat)供你使用。每个 stat 都是一个函数,因此你可以用通常的方式获取帮助,例如 ?stat_bin。要查看完整的 stat 列表,可以试试 ggplot2 速查表。
ggplot(data = diamonds) + geom_bar(mapping = aes(x = cut, y = ..prop..)) ggplot(data = diamonds) + geom_bar( mapping = aes(x = cut, fill = color, y = ..prop..) )