English · PDF 54
图表,你可以使用另外三个选项之一:"identity"、"dodge" 或 "fill":
ggplot( data = diamonds, mapping = aes(x = cut, fill = clarity) ) + geom_bar(alpha = 1/5, position = "identity") ggplot( data = diamonds, mapping = aes(x = cut, color = clarity) ) + geom_bar(fill = NA, position = "identity")
identity 位置调整方式对于二维几何对象(如点)更有用,它也是这些对象的默认值。
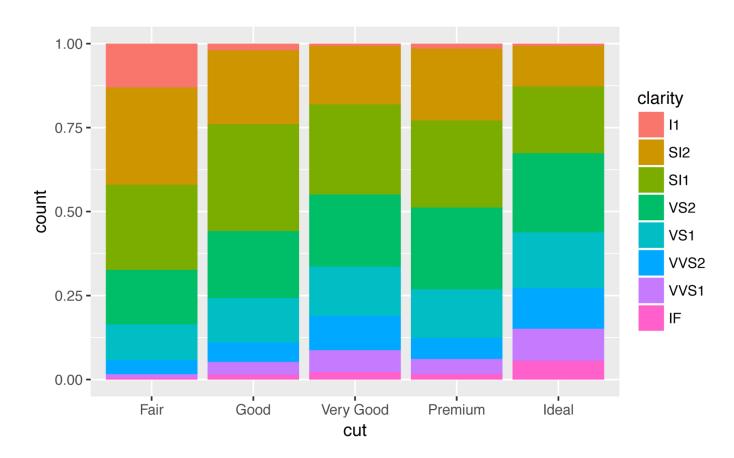
ggplot(data = diamonds) + geom_bar( mapping = aes(x = cut, fill = clarity), position = "fill" )