English · PDF 479
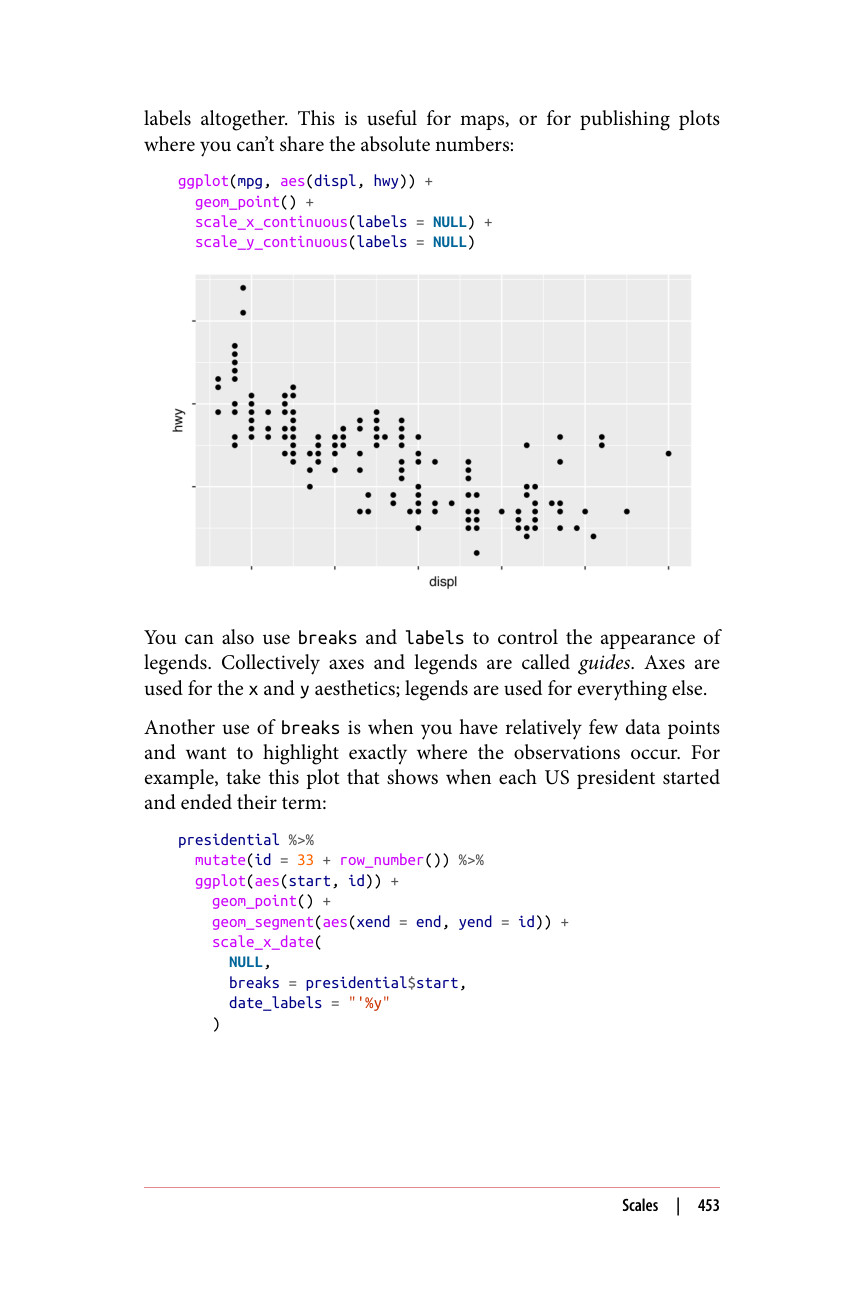
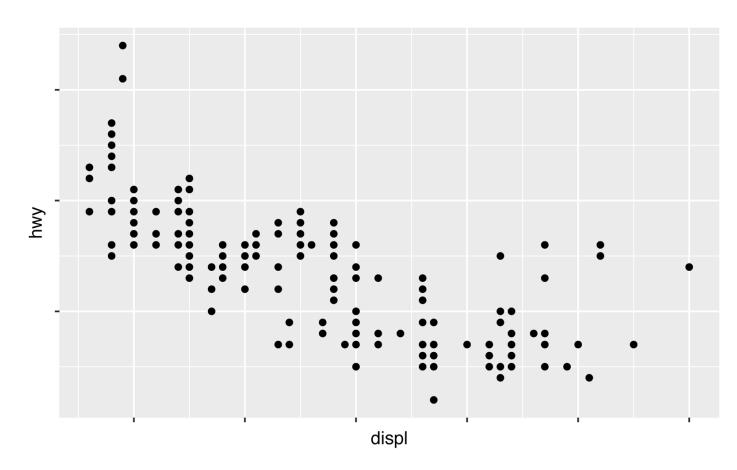
标签全部去掉。这对于地图,或者用于发布无法分享绝对数值的图表时非常有用:
ggplot(mpg, aes(displ, hwy)) + geom_point() + scale_x_continuous(labels = NULL) + scale_y_continuous(labels = NULL)
你还可以使用 breaks 和 labels 来控制图例的外观。坐标轴和图例统称为 guides(引导元素)。坐标轴用于 x 和 y 美学映射;图例则用于其他所有内容。
breaks 的另一个用途是当你只有相对较少的数据点,并希望精确突出观测值出现的位置时。例如,看下面这个图,它展示了每位美国总统任期的开始和结束时间:
presidential %>% mutate(id = 33 + row_number()) %>% ggplot(aes(start, id)) + geom_point() + geom_segment(aes(xend = end, yend = id)) + scale_x_date( NULL, breaks = presidential$start, date_labels = "'%y" )