English · PDF 373
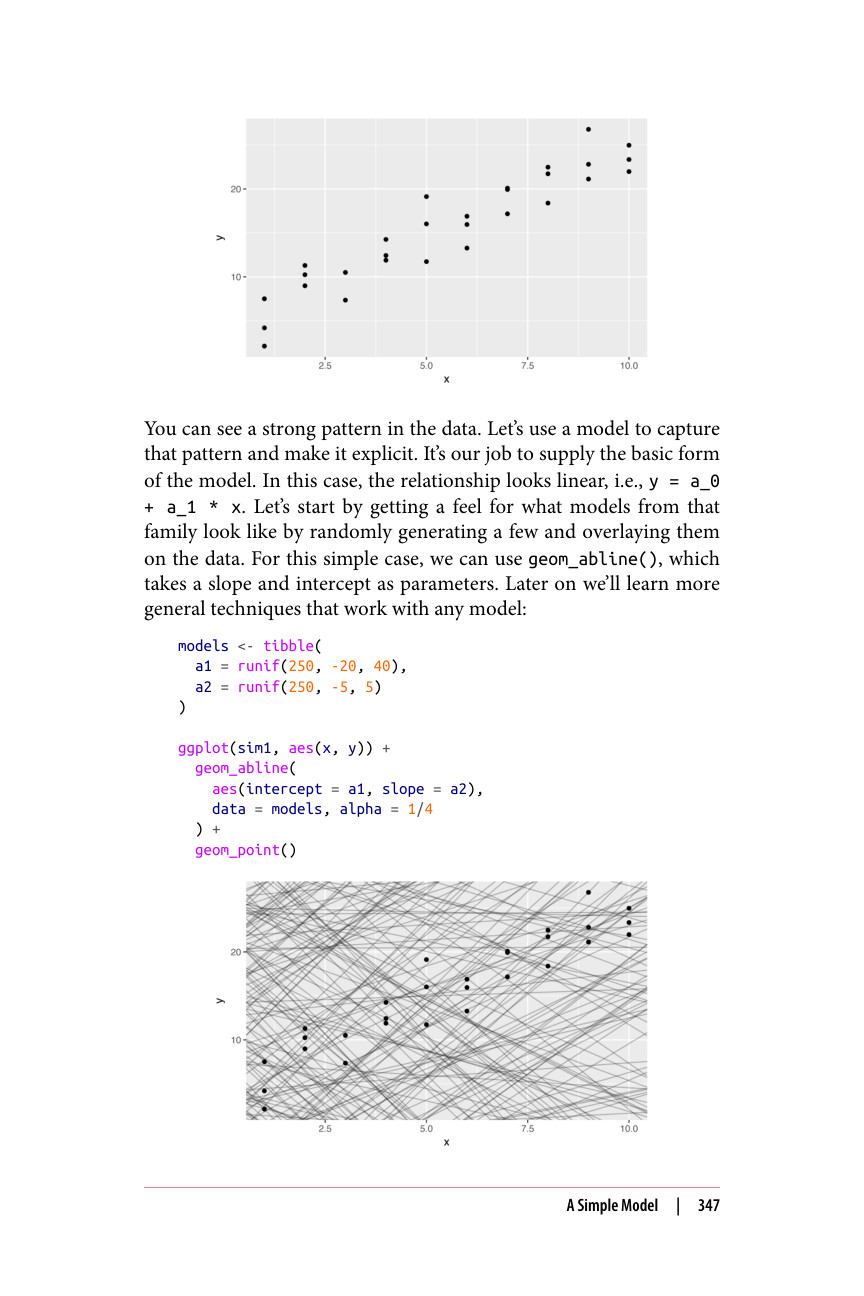
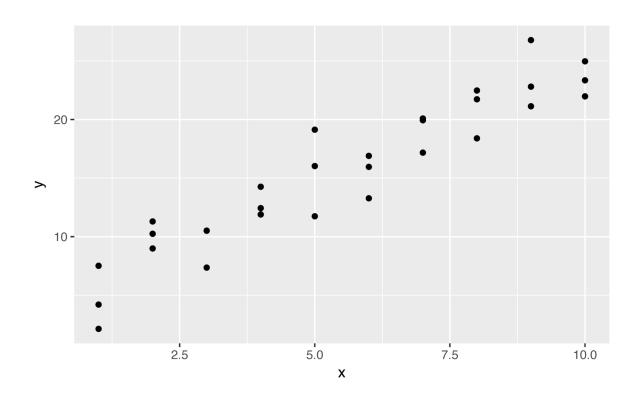
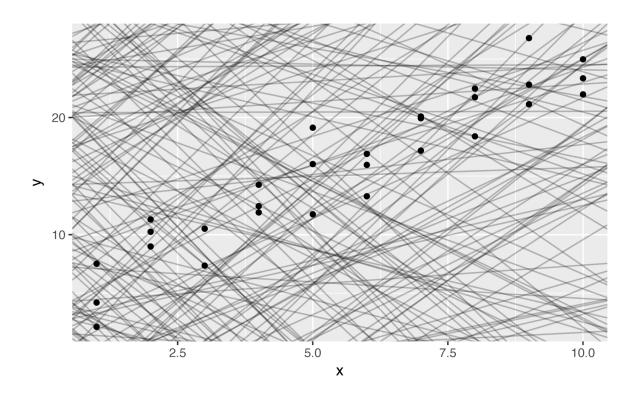
你可以在数据中看到一个明显的模式。让我们用一个模型来捕捉这个模式并使其显式化。我们的任务是提供模型的基本形式。在本例中,这种关系看起来是线性的,即 y = a_0 + a_1 * x。让我们先随机生成几个该族模型并将它们叠加在数据上,以感受一下这类模型的样子。对于这个简单的例子,我们可以使用 geom_abline(),它接受斜率和截距作为参数。稍后我们将学习适用于任何模型的更通用的技术:
models <- tibble( a1 = runif(250, -20, 40), a2 = runif(250, -5, 5) ) ggplot(sim1, aes(x, y)) + geom_abline( aes(intercept = a1, slope = a2), data = models, alpha = 1/4 ) + geom_point()