English · PDF 255
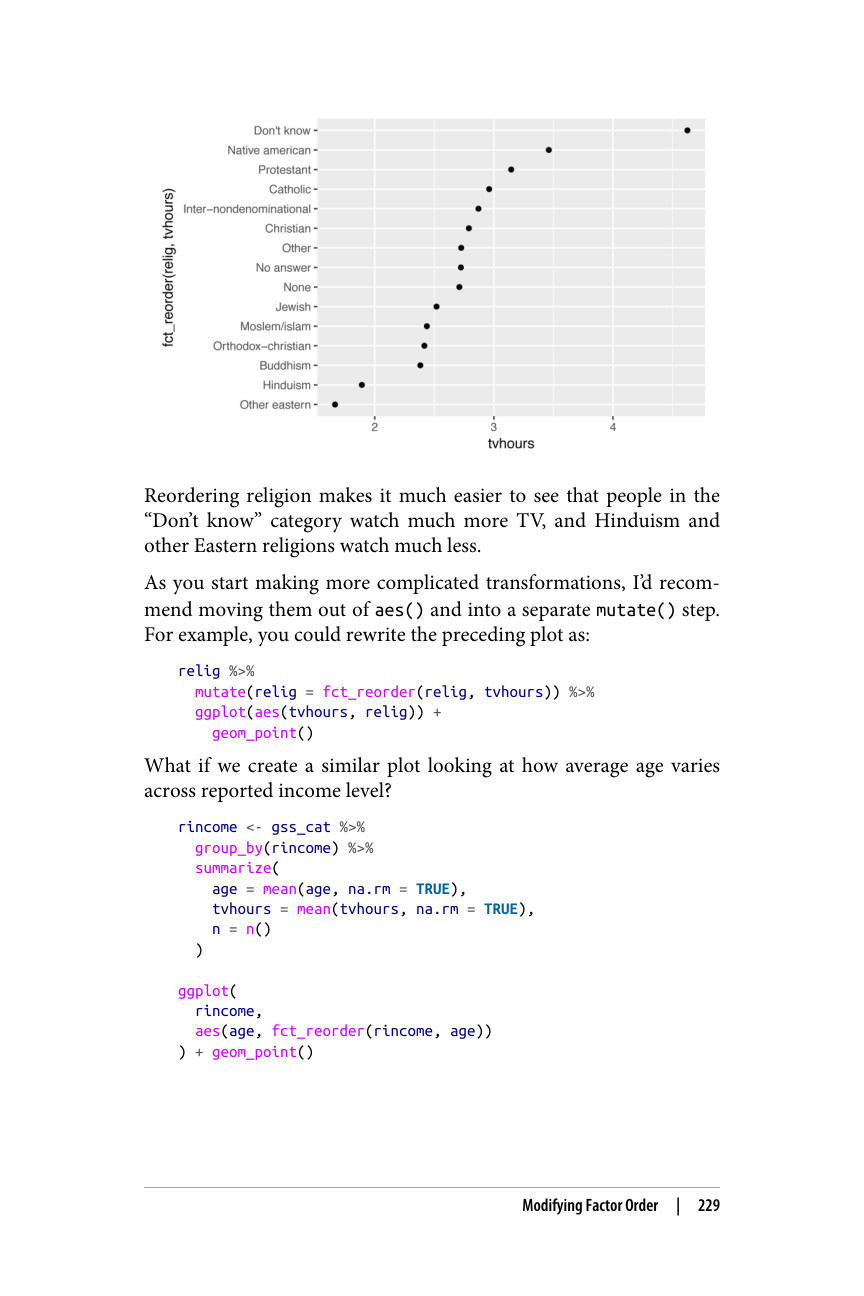
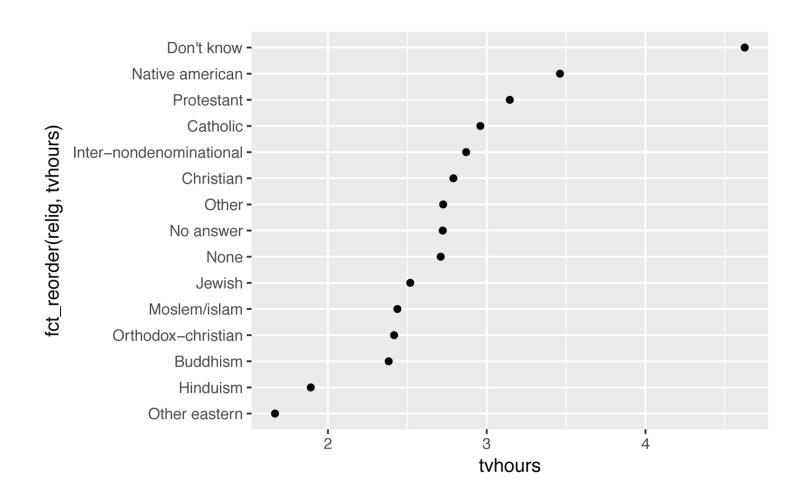
对宗教进行重新排序后,可以更容易地看出“不知道”类别的人看电视的时间要多得多,而印度教和其他东方宗教的人看电视的时间要少得多。
当你开始进行更复杂的变换时,我建议将它们从 aes() 中移出,放到单独的 mutate() 步骤中。例如,你可以将前面的图形重写为:
relig %>% mutate(relig = fct_reorder(relig, tvhours)) %>% ggplot(aes(tvhours, relig)) + geom_point()
如果我们创建一个类似的图形,看看平均年龄如何随报告的收入水平变化,会怎样呢?
rincome <- gss_cat %>% group_by(rincome) %>% summarize( age = mean(age, na.rm = TRUE), tvhours = mean(tvhours, na.rm = TRUE), n = n() ) ggplot( rincome, aes(age, fct_reorder(rincome, age)) ) + geom_point()