English · PDF 254
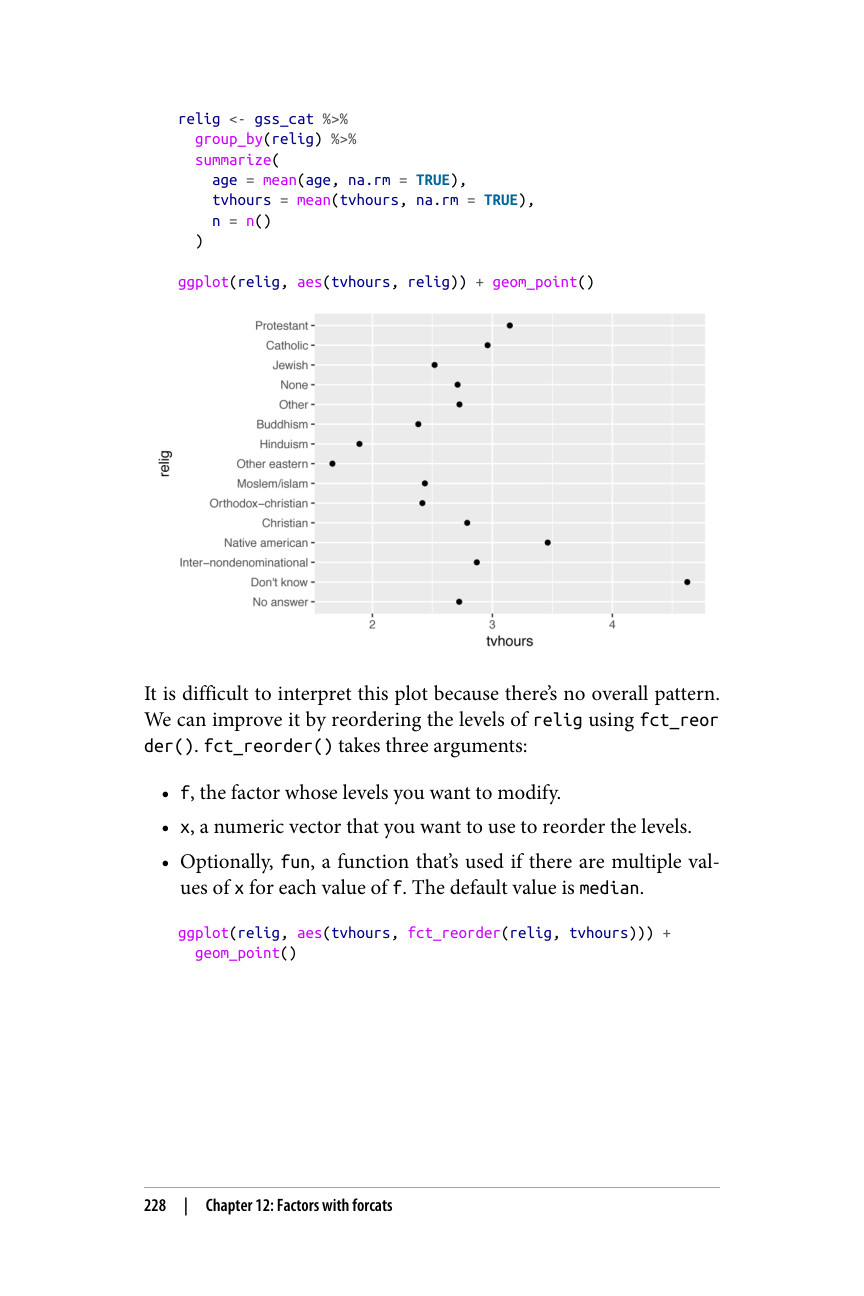
relig <- gss_cat %>% group_by(relig) %>% summarize( age = mean(age, na.rm = TRUE), tvhours = mean(tvhours, na.rm = TRUE), n = n() ) ggplot(relig, aes(tvhours, relig)) + geom_point()
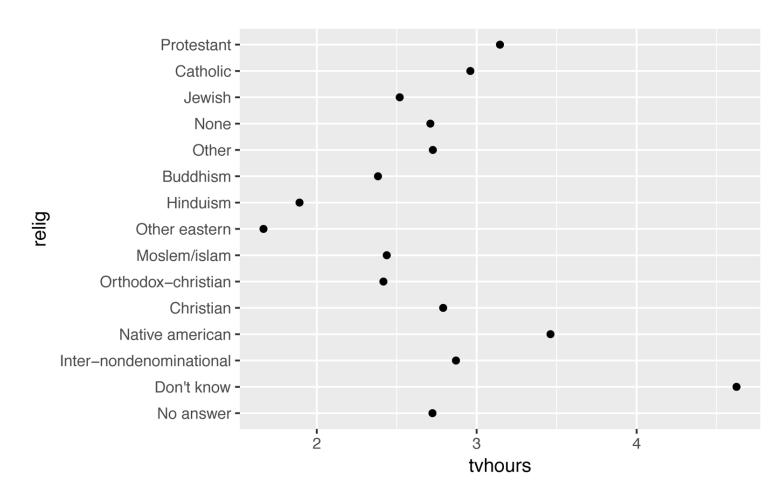
这张图很难解读,因为不存在整体模式。我们可以使用 fct_reor der() 对 relig 的水平重新排序来改进它。fct_reorder() 接受三个参数:
ggplot(relig, aes(tvhours, fct_reorder(relig, tvhours))) + geom_point()