English · PDF 181
#> 6 Brazil 1999 population 172006362 #> # ... with 6 more rows
要整理这些数据,我们首先以类似 gather() 的方式分析其表示形式。不过这一次,我们只需要两个参数:
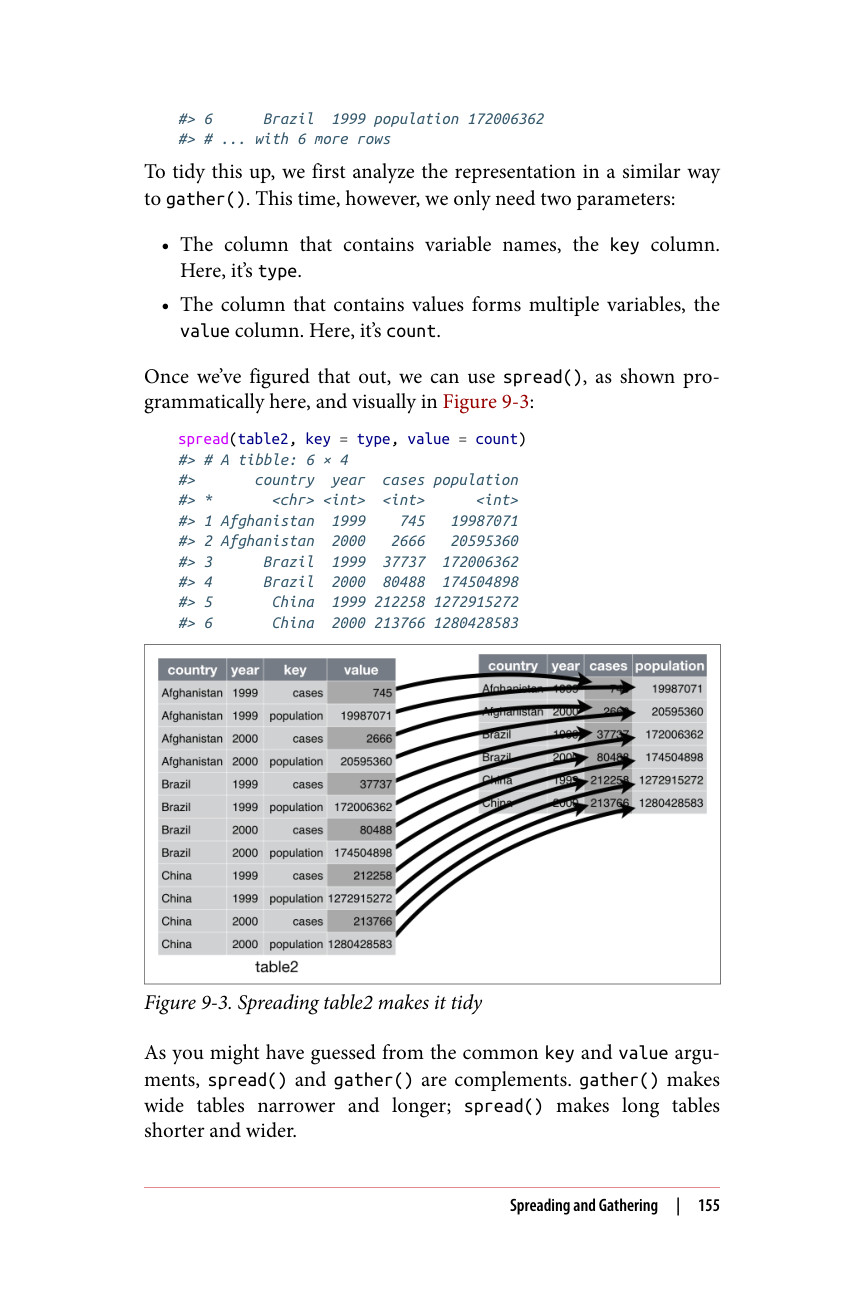
弄清楚这些之后,我们就可以使用 spread(),如下面的程序代码所示,其可视化效果见图 9-3:
spread(table2, key = type, value = count) #> # A tibble: 6 × 4 #> country year cases population #> *
| 国家 | 年份 | 键 | 值 | 国家 | 年份 | 病例 | 人口 |
|---|---|---|---|---|---|---|---|
| 阿富汗 | 1999 | 病例 | 745 | 阿富汗 | 1999 | 745 | 19987071 |
| 阿富汗 | 1999 | 人口 | 19987071 | 阿富汗 | 2000 | 269 | 20595360 |
| 阿富汗 | 2000 | 病例 | 2666 | 巴西 | 1999 | 37737 | 172006362 |
| 阿富汗 | 2000 | 人口 | 20595360 | 巴西 | 2000 | 80488 | 1745044898 |
| 巴西 | 1999 | 病例 | 37737 | 中国 | 1999 | 212258 | 1272915272 |
| 巴西 | 1999 | 人口 | 172006362 | 中国 | 2000 | 213766 | 1280428583 |
| 巴西 | 2000 | 病例数 | 80488 | ||||
| 巴西 | 2000 | 人口 | 1745044898 | ||||
| 中国 | 1999 | 病例数 | 212258 | ||||
| 中国 | 1999 | 人口 | 1272915272 | ||||
| 中国 | 2000 | 病例数 | 213766 | ||||
| 中国 | 2000 | 人口 | 1280428583 |
图 9-3. 对 table2 进行 spread 操作使其变得整洁
正如你可能从它们共同的 key 和 value 参数中猜到的那样,spread() 和 gather() 是互补的。gather() 使宽表变得更窄更长;spread() 使长表变得更短更宽。