English · PDF 180
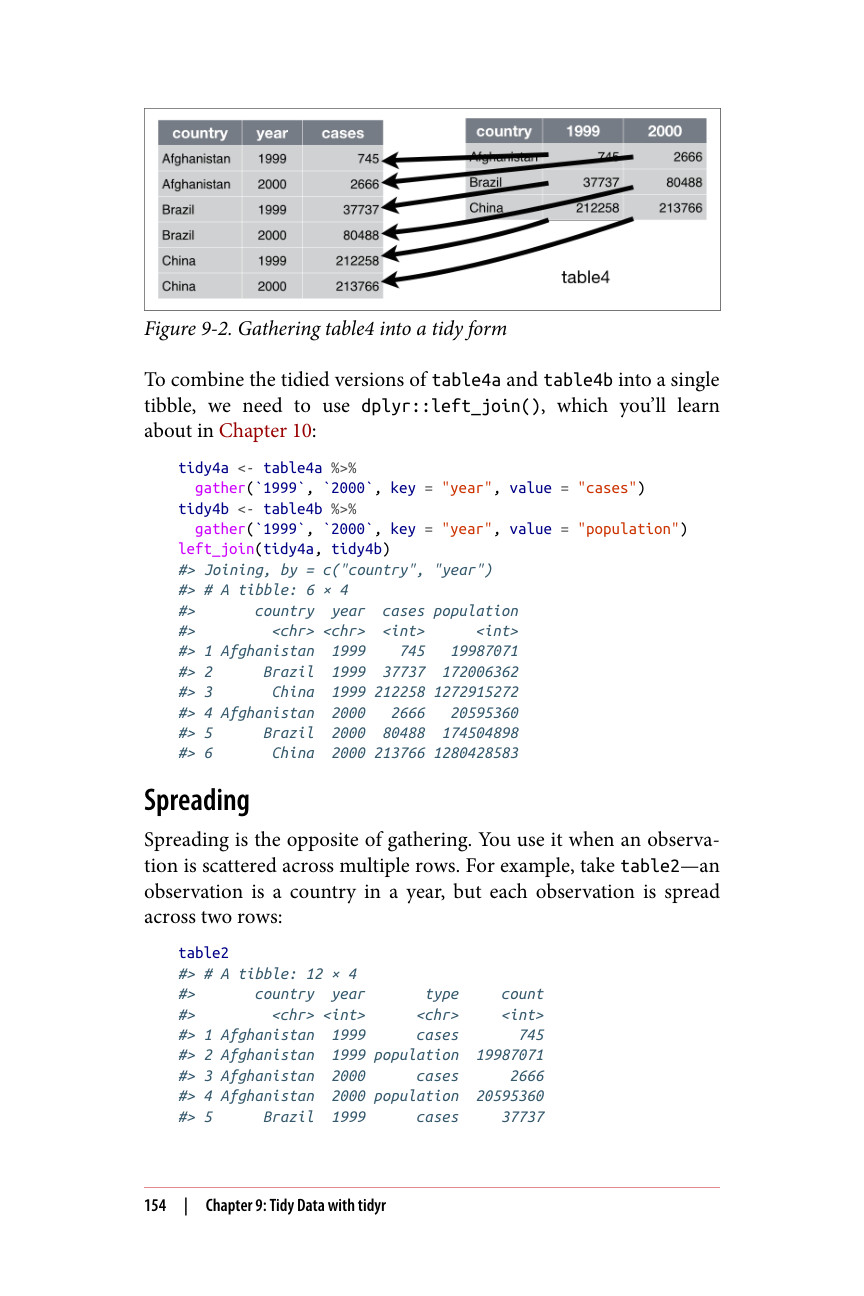
| 国家 | 年份 | 病例数 | 国家 | 1999 | 2000 |
|---|---|---|---|---|---|
| 阿富汗 | 1999 | 745 | 阿富汗 | 745 | 2666 |
| 阿富汗 | 2000 | 2666 | 巴西 | 37737 | 80488 |
| 巴西 | 1999 | 37737 | 中国 | 212258 | 213766 |
| 巴西 | 2000 | 80488 | |||
| 中国 | 1999 | 212258 | |||
| 中国 | 2000 | 213766 |
图 9-2. 将 table4 整理成整洁形式
要将 table4a 和 table4b 整理后的版本合并成一个 tibble,我们需要使用 dplyr::left_join(),你将在第 10 章中学习它:
tidy4a <- table4a %>% gather(1999, 2000, key = "year", value = "cases") tidy4b <- table4b %>% gather(1999, 2000, key = "year", value = "population") left_join(tidy4a, tidy4b) #> Joining, by = c("country", "year") #> # A tibble: 6 × 4 #> country year cases population #>
分散是整理的逆操作。当一个观测分散在多行中时,你需要使用它。例如,以 table2 为例——一个观测是某国在某一年,但每个观测分散在两行中:
table2 #> # A tibble: 12 × 4 #> country year type count #>