English · PDF 58
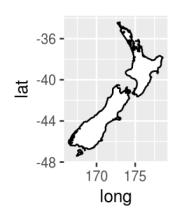
nz <- map_data("nz")
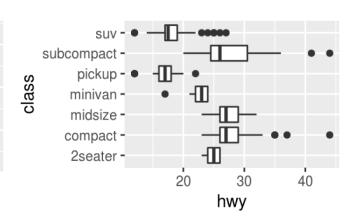
ggplot(nz, aes(long, lat, group = group)) + geom_polygon(fill = "white", color = "black")
ggplot(nz, aes(long, lat, group = group)) + geom_polygon(fill = "white", color = "black") + coord_quickmap()
bar <- ggplot(data = diamonds) + geom_bar( mapping = aes(x = cut, fill = cut), show.legend = FALSE, width = 1 ) + theme(aspect.ratio = 1) + labs(x = NULL, y = NULL)
bar + coord_flip() bar + coord_polar()