English · PDF 57
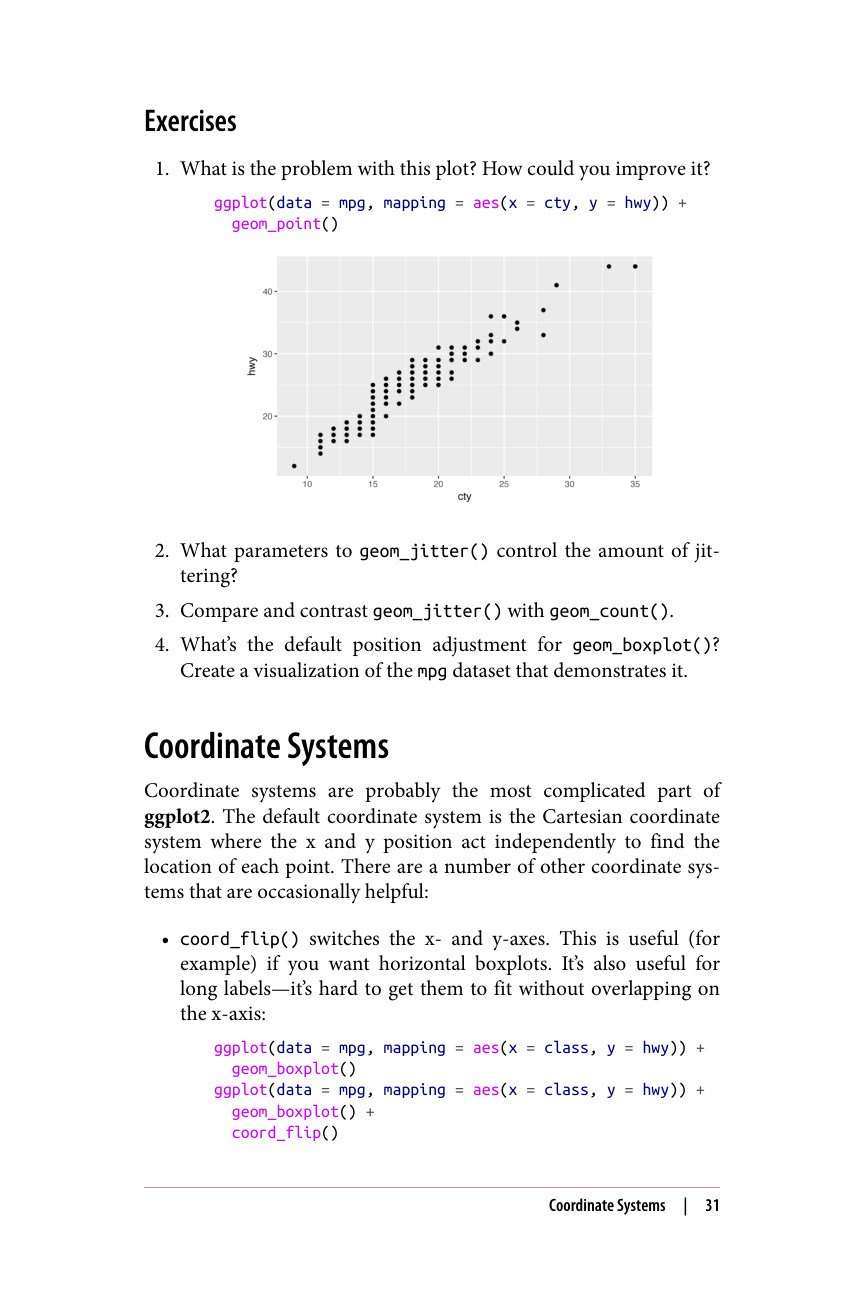
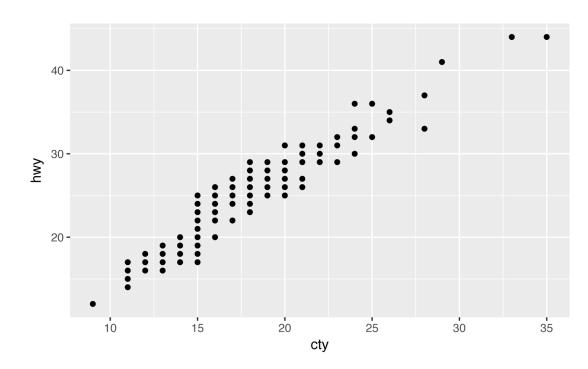
ggplot(data = mpg, mapping = aes(x = cty, y = hwy)) + geom_point()
坐标系可能是 ggplot2 中最复杂的部分。默认的坐标系是笛卡尔坐标系,其中 x 和 y 位置相互独立地确定每个点的位置。还有一些其他坐标系偶尔会很有用:
ggplot(data = mpg, mapping = aes(x = class, y = hwy)) + geom_boxplot() ggplot(data = mpg, mapping = aes(x = class, y = hwy)) + geom_boxplot() + coord_flip()