English · PDF 472
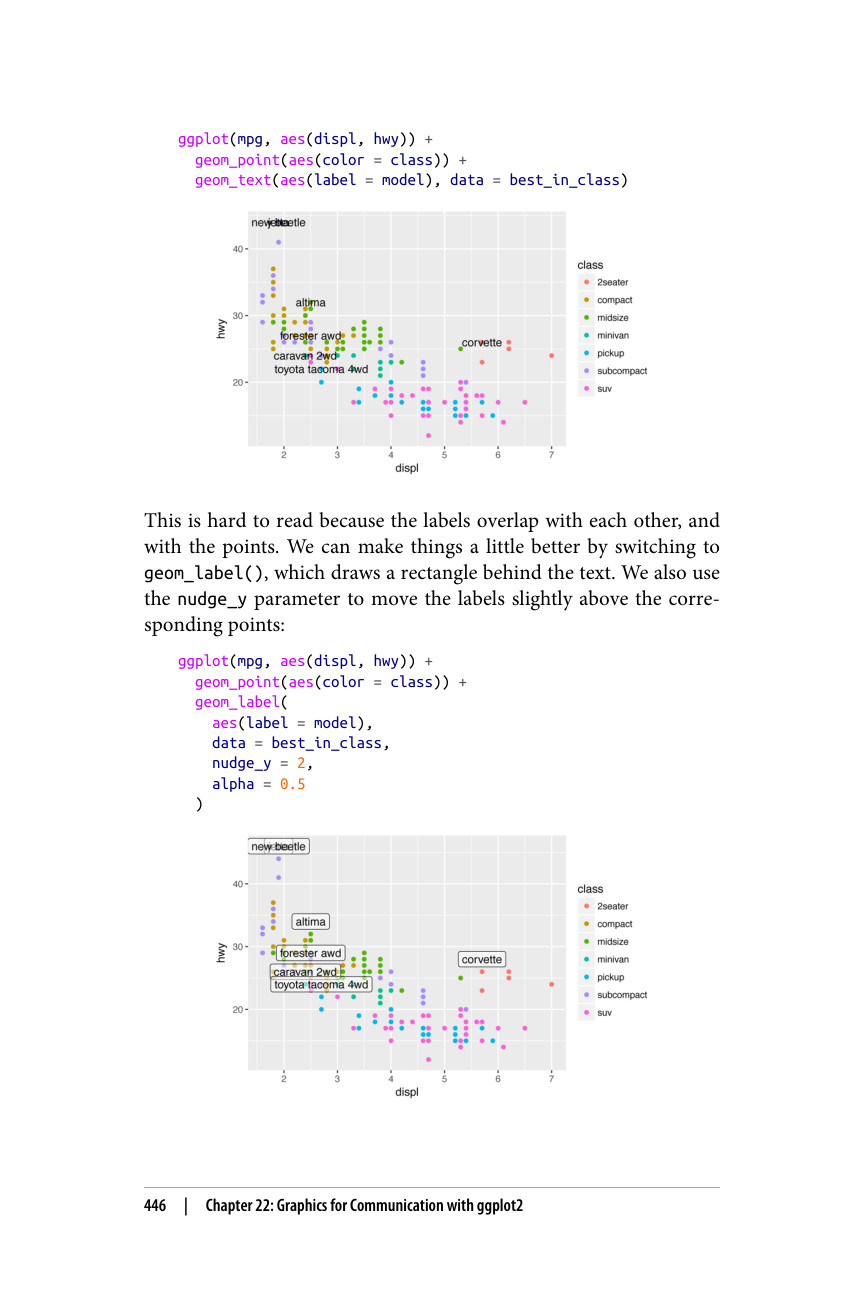
ggplot(mpg, aes(displ, hwy)) + geom_point(aes(color = class)) + geom_text(aes(label = model), data = best_in_class)
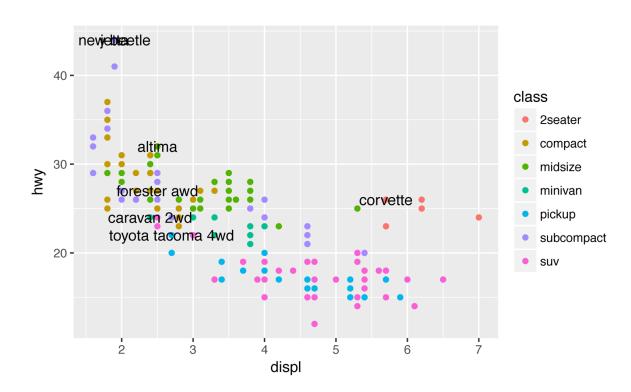
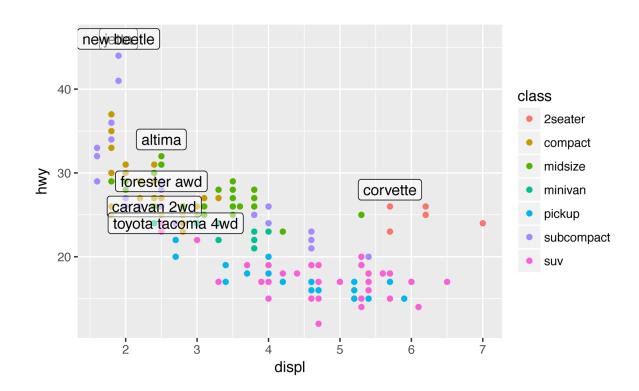
这很难阅读,因为标签彼此重叠,并且与数据点重叠。我们可以改用 geom_label() 来稍微改善一下,它会在文字后面绘制一个矩形。我们还使用 nudge_y 参数将标签略微移动到相应数据点的上方:
ggplot(mpg, aes(displ, hwy)) + geom_point(aes(color = class)) + geom_label( aes(label = model), data = best_in_class, nudge_y = 2, alpha = 0.5 )