English · PDF 434
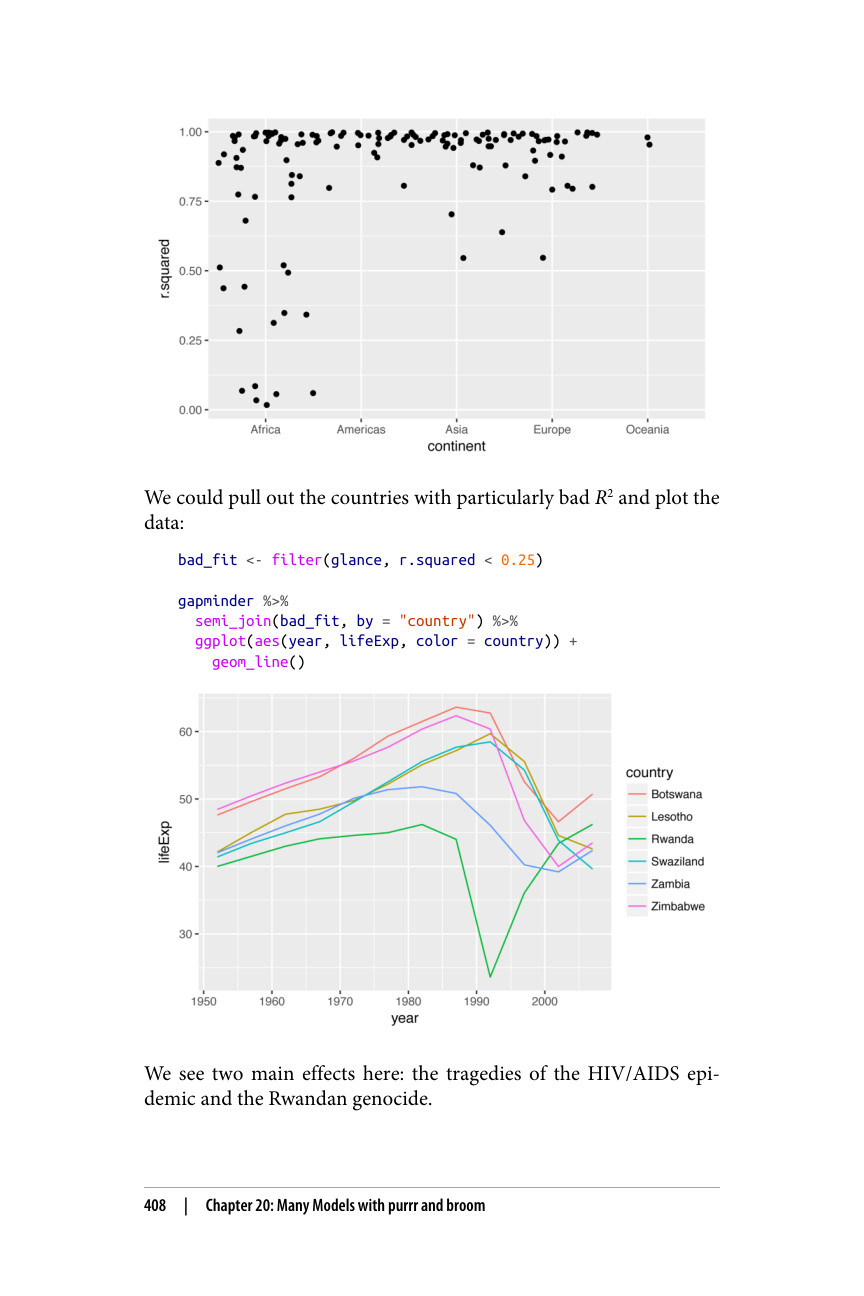
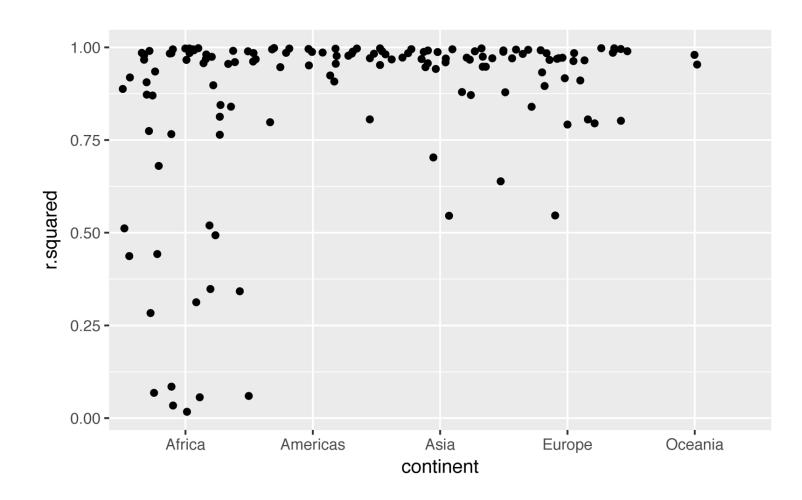
我们可以提取出 R 2 特别差的国家并绘制数据:
bad_fit <- filter(glance, r.squared < 0.25) gapminder %>% semi_join(bad_fit, by = "country") %>% ggplot(aes(year, lifeExp, color = country)) + geom_line()
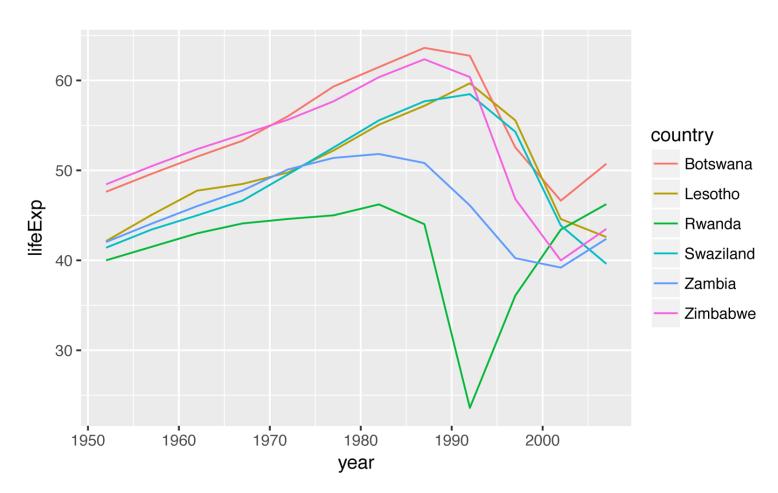
我们在这里看到两个主要影响:HIV/AIDS 流行病的悲剧和卢旺达种族灭绝。