English · PDF 418
我们可以通过将模型的预测叠加到原始数据上来观察这个问题:
grid <- daily %>% data_grid(wday, term) %>% add_predictions(mod2, "n") ggplot(daily, aes(wday, n)) + geom_boxplot() + geom_point(data = grid, color = "red") + facet_wrap(~ term)
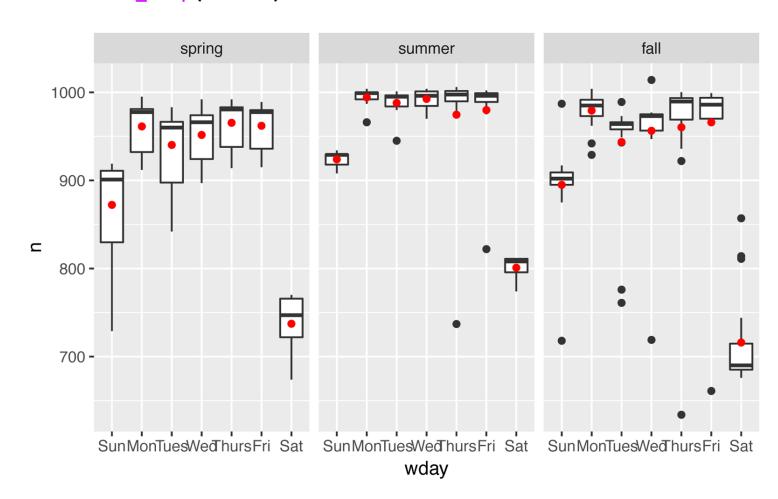
我们的模型找到的是平均效应,但存在很多较大的异常值,因此平均值往往偏离典型值。我们可以