English · PDF 274
update(hour = 400) #> [1] "2015-02-17 16:00:00 UTC"
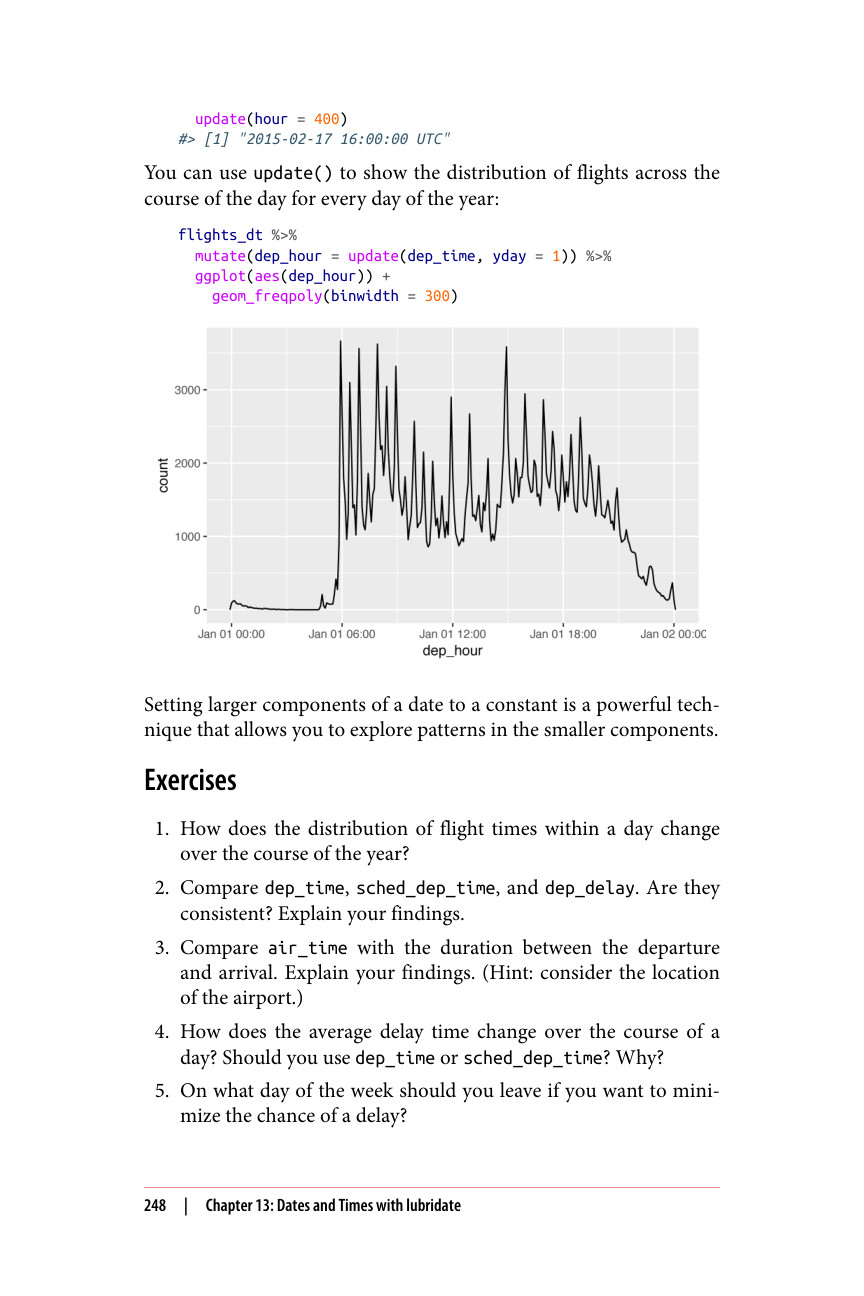
你可以使用 update() 来展示一年中每一天的航班在一天内不同时段的分布情况:
flights_dt %>% mutate(dep_hour = update(dep_time, yday = 1)) %>% ggplot(aes(dep_hour)) + geom_freqpoly(binwidth = 300)
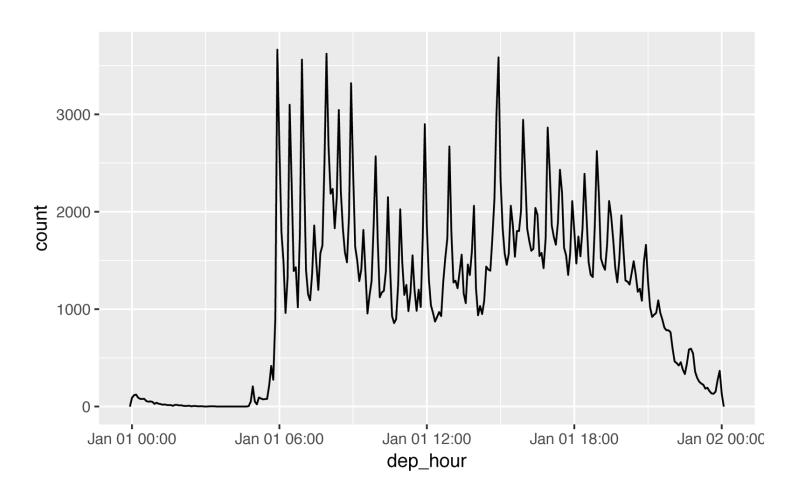
将日期中较大的分量设置为常量是一种强大的技术,它可以帮助你探索较小分量中的模式。