English · PDF 268
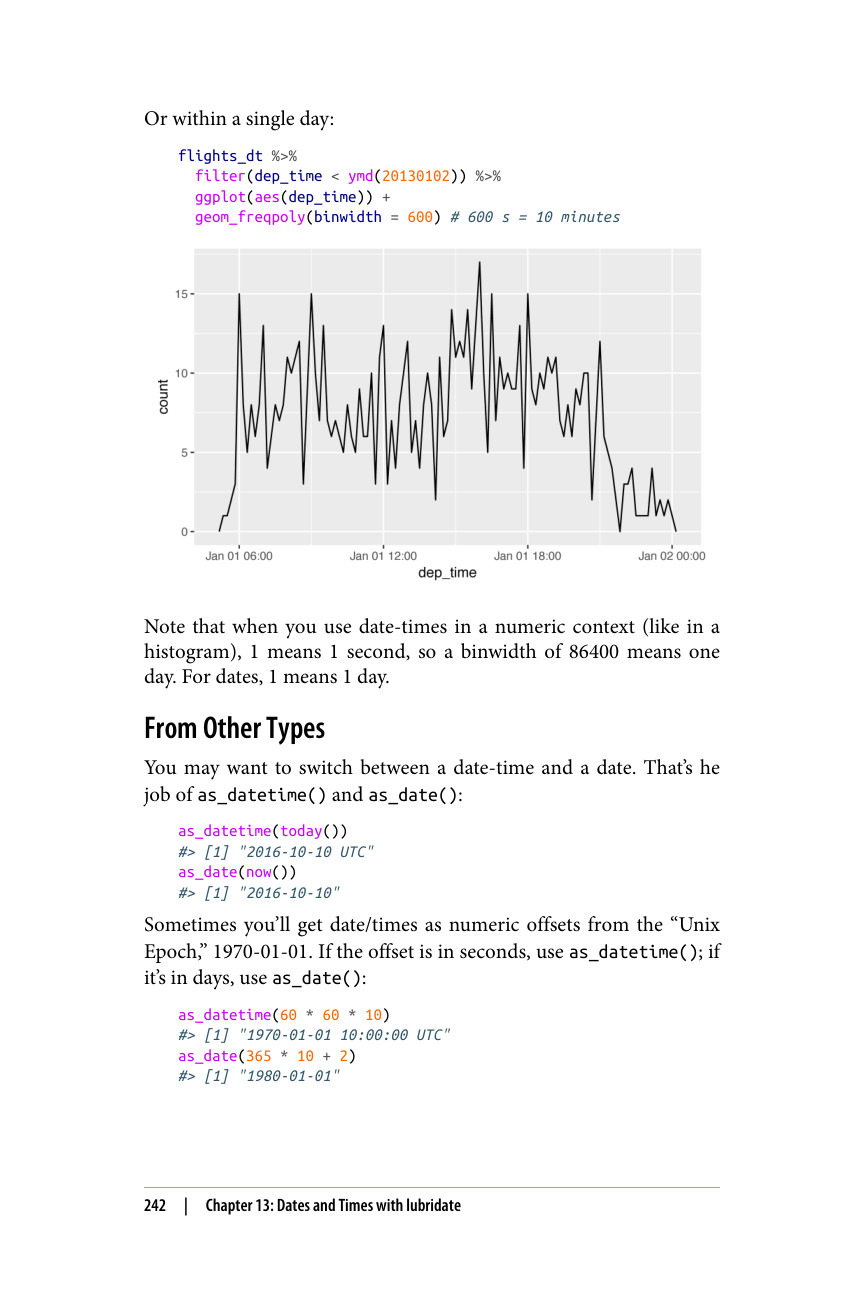
或者在单日内:
flights_dt %>% filter(dep_time < ymd(20130102)) %>% ggplot(aes(dep_time)) + geom_freqpoly(binwidth = 600) # 600 秒 = 10 分钟
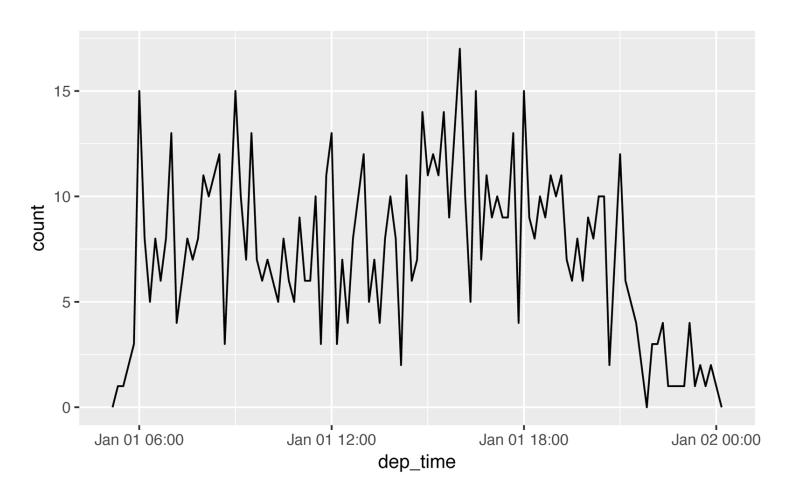
注意,当你在数值上下文中使用日期时间(比如在直方图中)时,1 表示 1 秒,因此 binwidth 为 86400 表示一天。对于日期,1 表示 1 天。
你可能需要在日期时间和日期之间切换。这就是 as_datetime() 和 as_date() 的职责:
as_datetime(today()) #> [1] "2016-10-10 UTC" as_date(now()) #> [1] "2016-10-10"
有时你会得到以相对于“Unix 纪元”(1970-01-01)的数值偏移量表示的日期/时间。如果偏移量以秒为单位,使用 as_datetime();如果以天为单位,使用 as_date():
as_datetime(60 * 60 * 10) #> [1] "1970-01-01 10:00:00 UTC" as_date(365 * 10 + 2) #> [1] "1980-01-01"