English · PDF 257
当你在为绘图中的线条着色时,另一种重排序方式会很有用。fct_reorder2() 根据 y 值对因子进行重排序,这些 y 值与最大的 x 值相关联。这使得图形更易于阅读,因为线条颜色与图例对齐:
by_age <- gss_cat %>% filter(!is.na(age)) %>% group_by(age, marital) %>% count() %>% mutate(prop = n / sum(n)) ggplot(by_age, aes(age, prop, color = marital)) + geom_line(na.rm = TRUE) ggplot( by_age, aes(age, prop, color = fct_reorder2(marital, age, prop)) ) + geom_line() + labs(color = "marital")
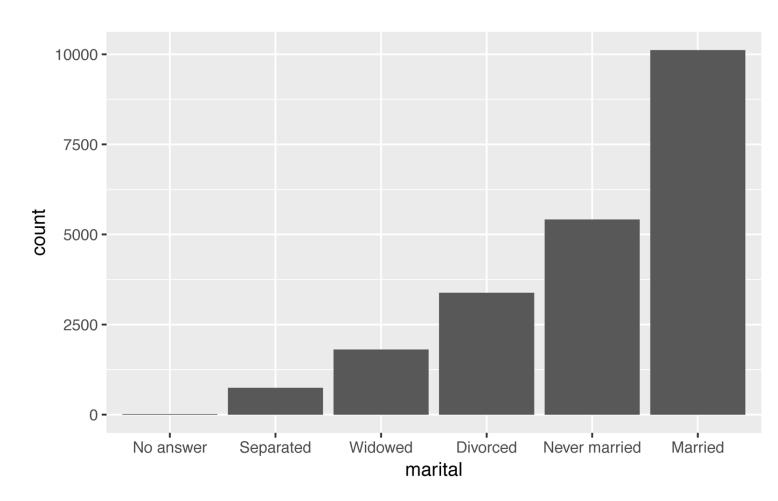
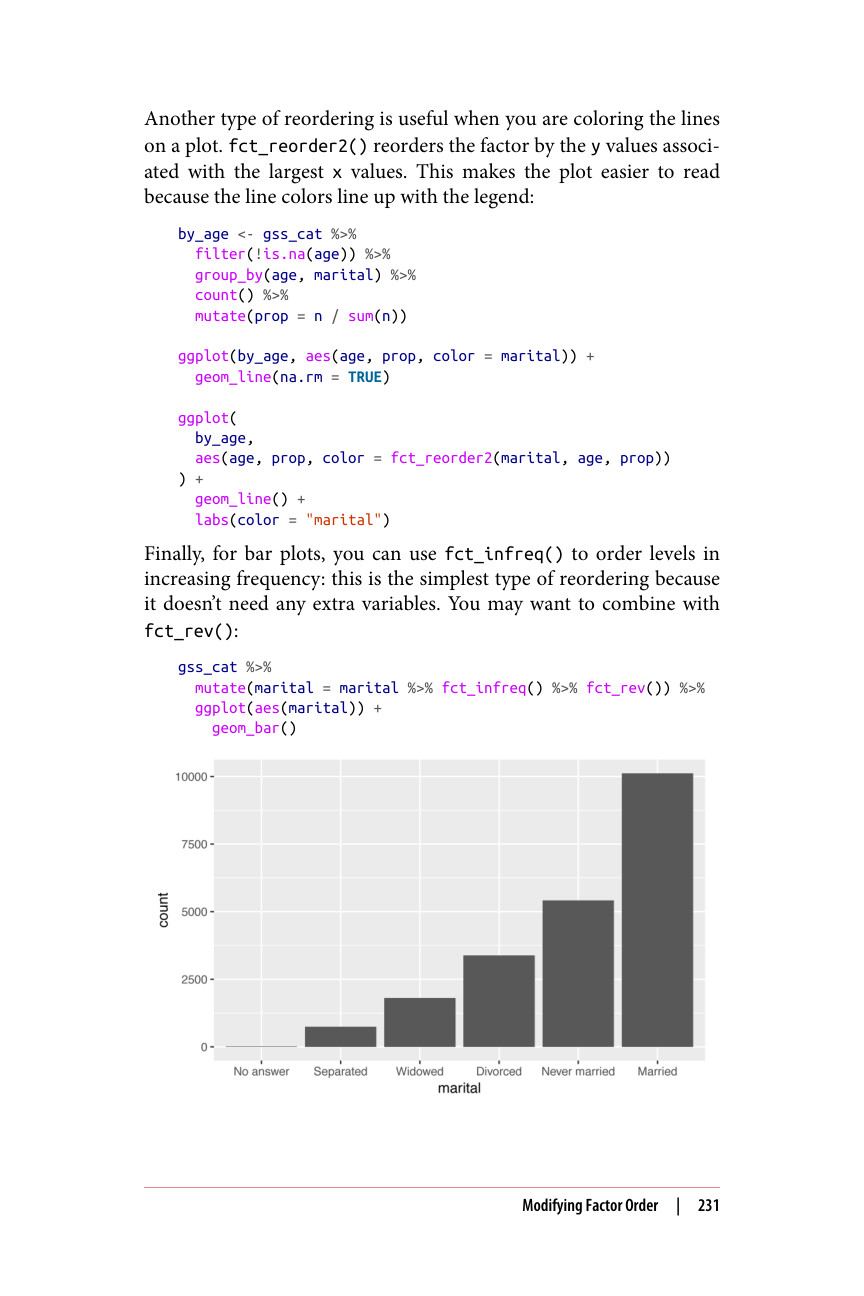
最后,对于条形图,你可以使用 fct_infreq() 按频数递增的顺序对水平进行排序:这是最简单的重排序类型,因为它不需要任何额外的变量。你可能想将其与 fct_rev() 结合使用:
gss_cat %>% mutate(marital = marital %>% fct_infreq() %>% fct_rev()) %>% ggplot(aes(marital)) + geom_bar()