English · PDF 115
monds 数据集。异常值存在的唯一证据是 y 轴的区间范围异常地宽:
ggplot(diamonds) + geom_histogram(mapping = aes(x = y), binwidth = 0.5)
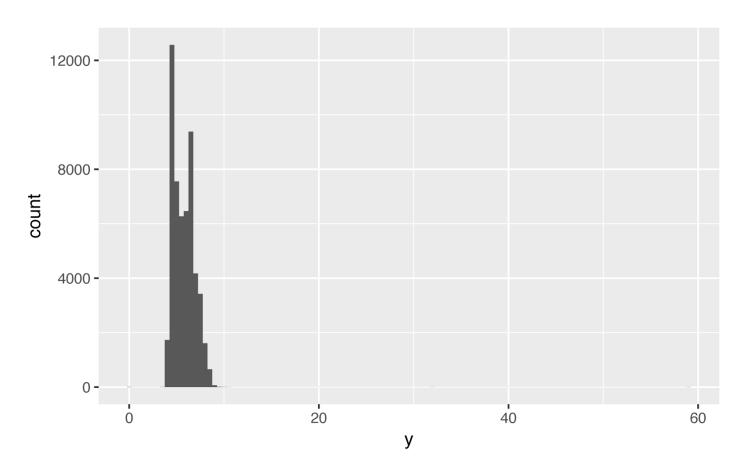
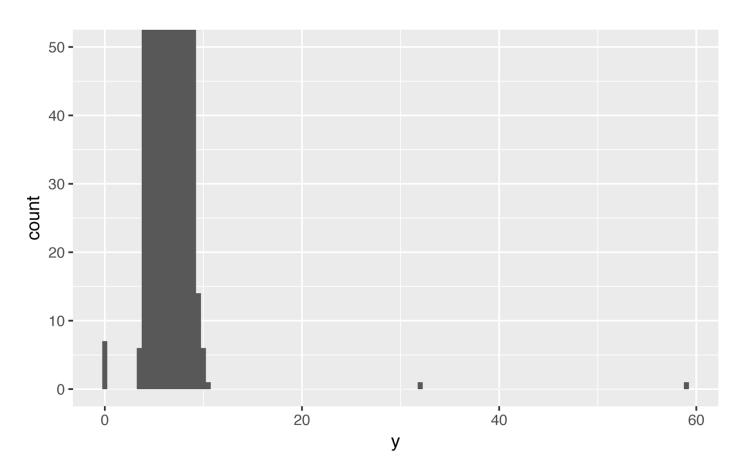
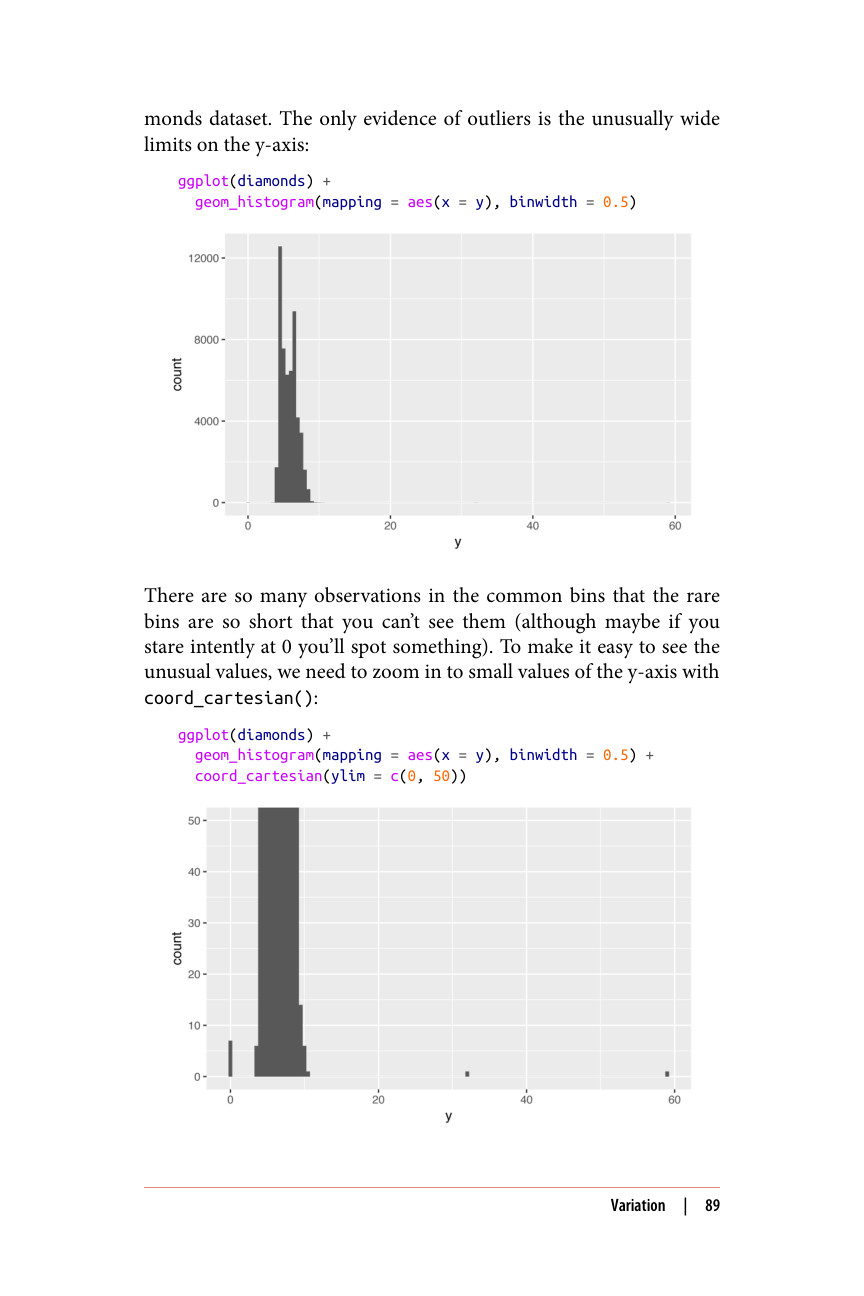
常见分箱中的观测值太多,导致稀有分箱非常矮,以至于你看不到它们(不过如果你仔细盯着 0 看,也许能发现点什么)。为了便于看到异常值,我们需要使用 coord_cartesian() 将 y 轴放大到较小的数值范围:
ggplot(diamonds) + geom_histogram(mapping = aes(x = y), binwidth = 0.5) + coord_cartesian(ylim = c(0, 50))