English · PDF 46
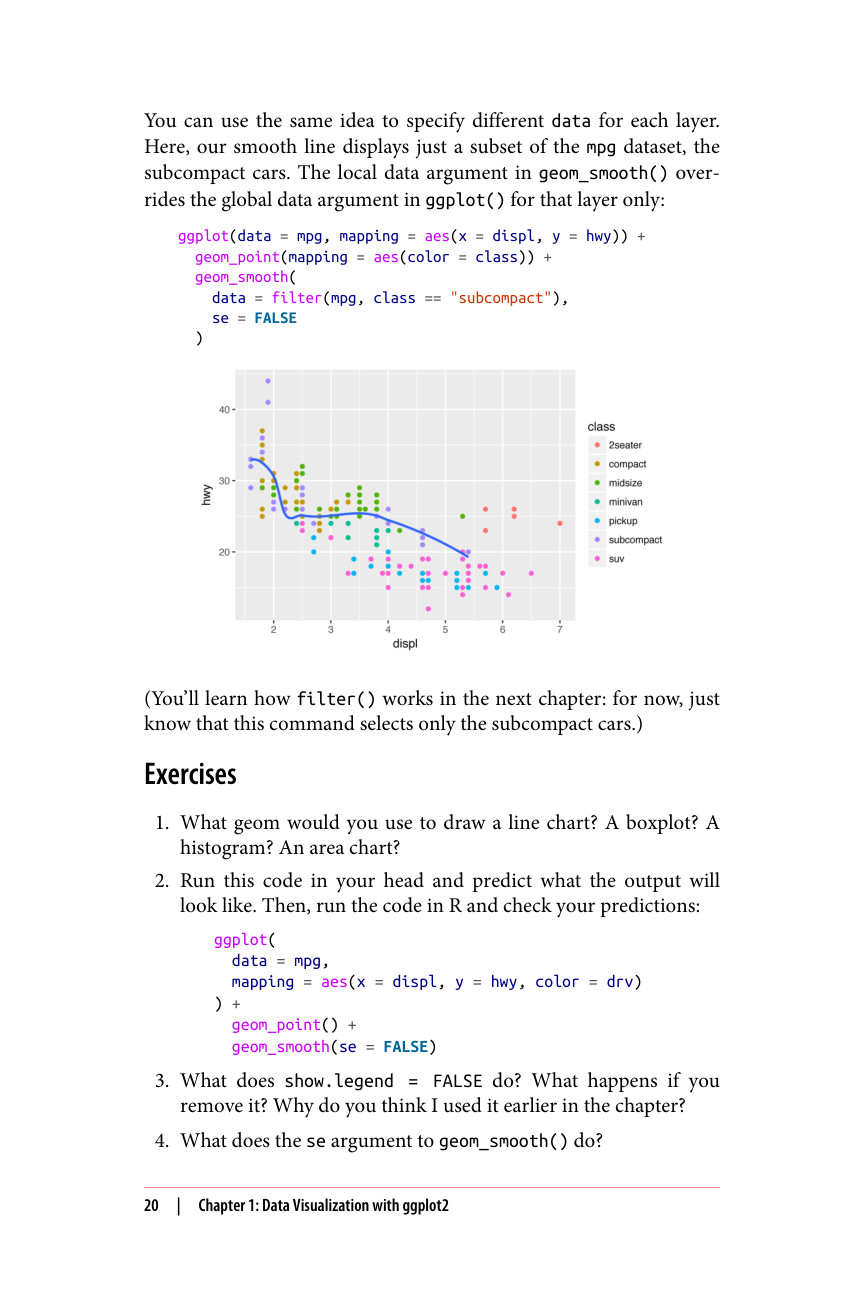
你可以用同样的思路为每个图层指定不同的数据。这里,我们的平滑线只显示了 mpg 数据集的一个子集,即小型车。geom_smooth() 中的局部数据参数仅在该图层中覆盖 ggplot() 中的全局数据参数:
ggplot(data = mpg, mapping = aes(x = displ, y = hwy)) + geom_point(mapping = aes(color = class)) + geom_smooth( data = filter(mpg, class == "subcompact"), se = FALSE )
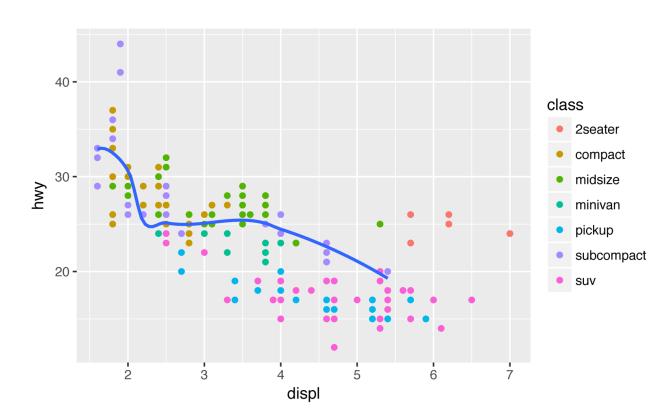
(你将在下一章学习 filter() 的工作原理:现在只需知道这条命令只选择了小型车。)
ggplot( data = mpg, mapping = aes(x = displ, y = hwy, color = drv) ) + geom_point() + geom_smooth(se = FALSE)